[BETA] Guide for Patrol VS Code extension
How to setup
- Install the extension from VS Code Marketplace or Open VSX Registry for other VSCode-like editors, eg. Cursor. It requires Dart extension - if you don't have it, you'll be prompted to install it.
- In your project's pubspec.yaml, add a line to patrol section:
patrol:
  flavor: dev
  test_file_suffix: _patrol.dart # add this line
  android:
    package_name: pl.leancode.patrol.example.dev
  ios:
    bundle_id: pl.leancode.patrol.Example
- Rename your test files - change the suffix from
_test.dartto_patrol.dart. - If you have a method wrapping
patrolTest(), you need to add an annotation to it:
@isTest // add this annotation here
void patrolWrapper(
    String testName, Future<void> Function(PatrolIntegrationTester) test) {
  patrolTest(testName, test);
}
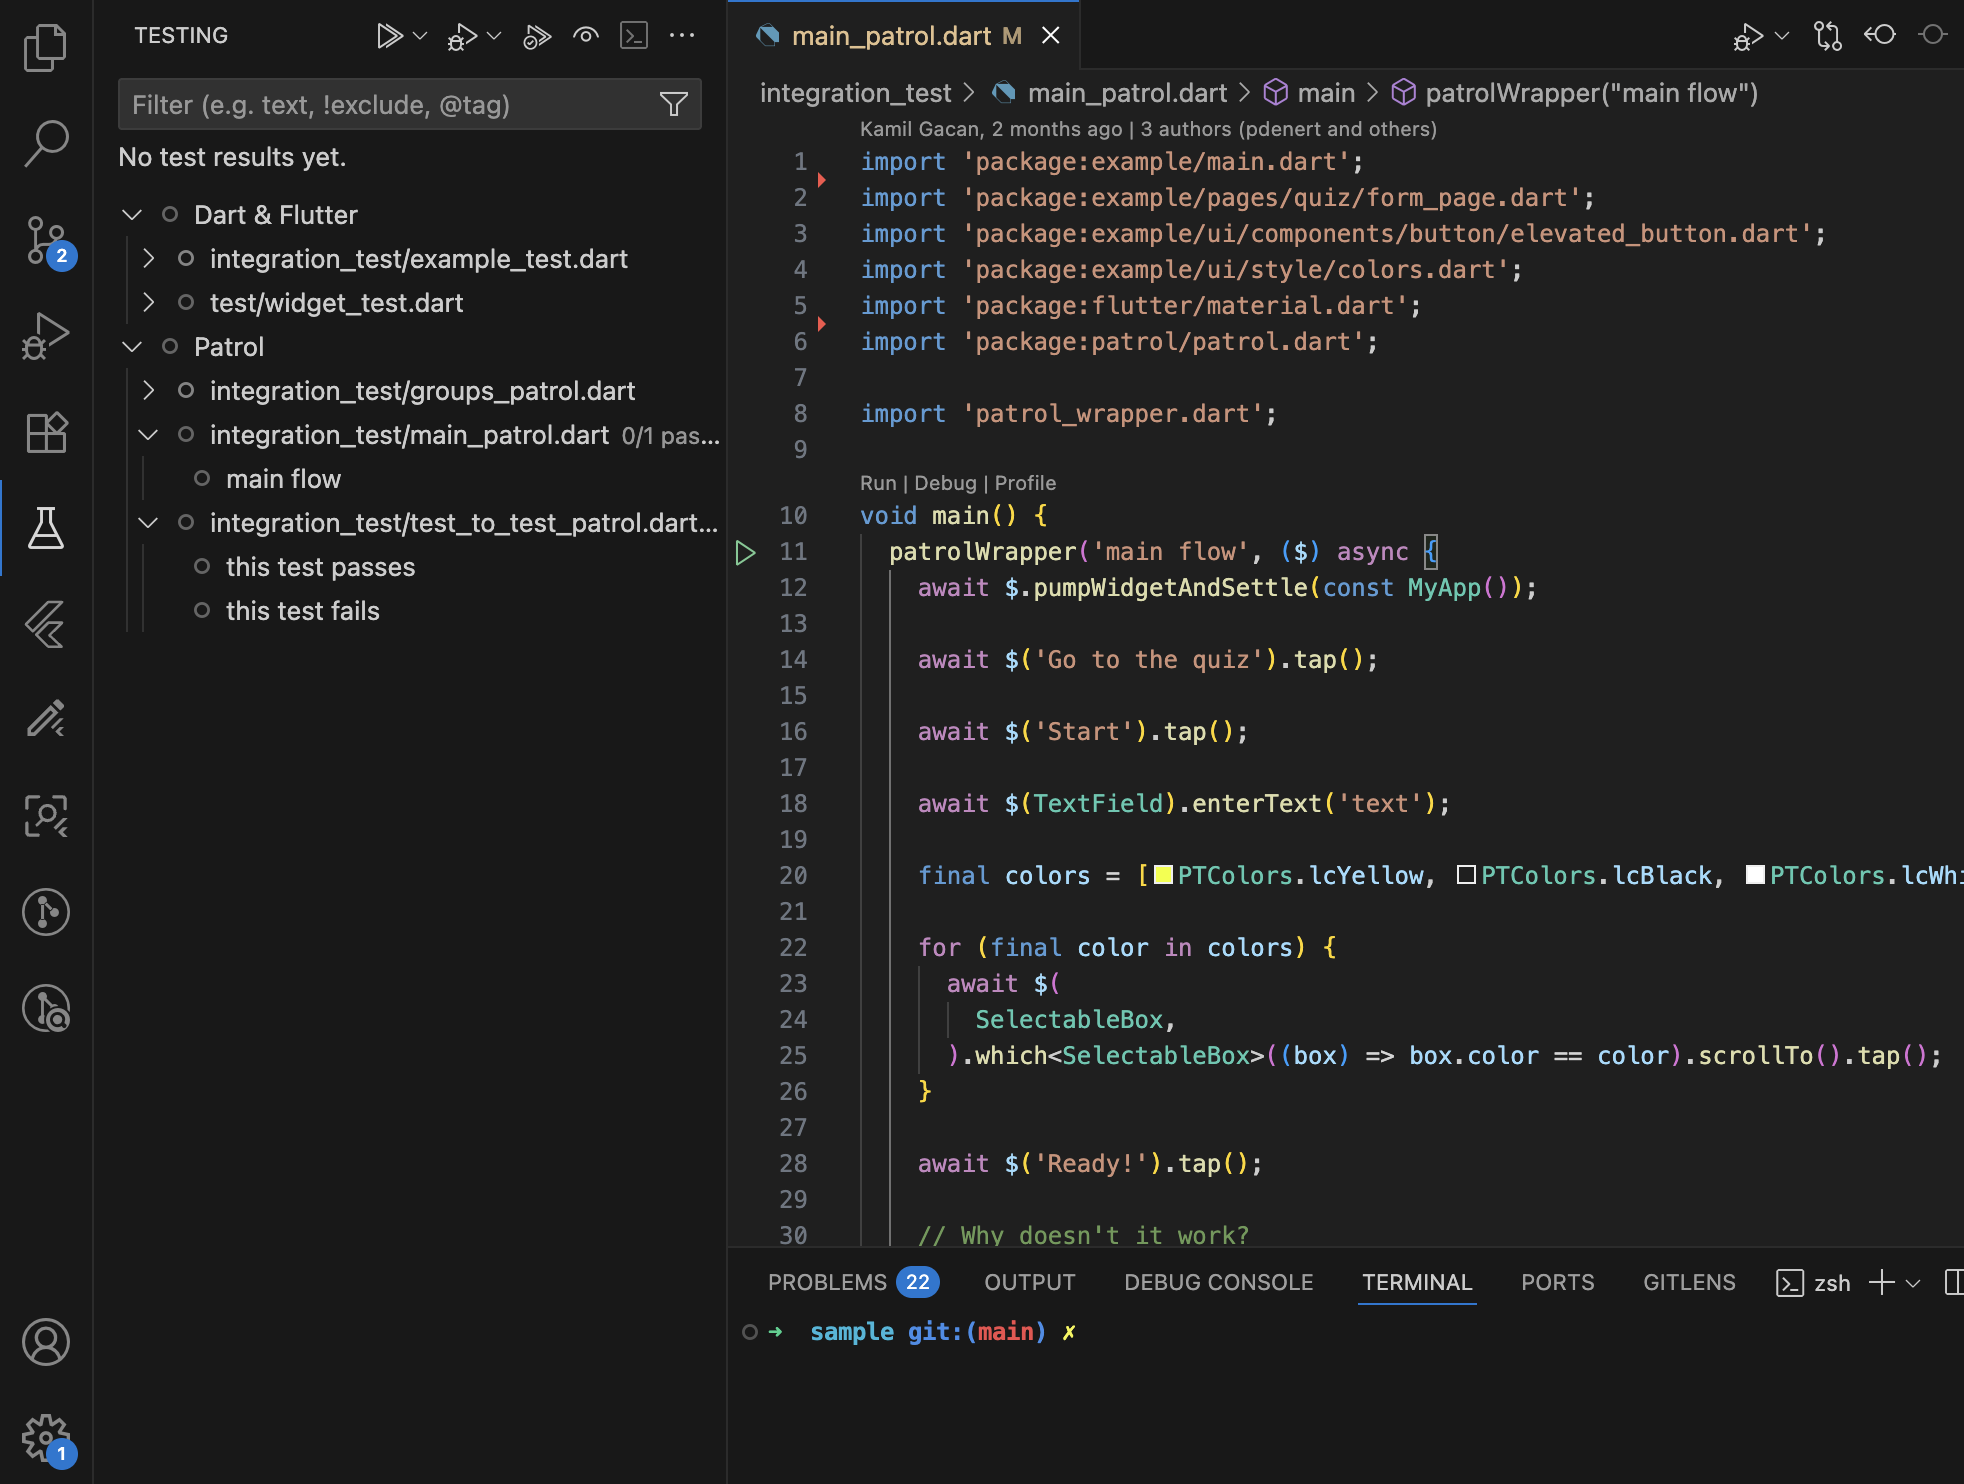
You should now see patrol tests in the Test Explorer tab in VS Code. They should
be in Patrol section. Also you should see a green play button next to
patrolTest method invocation (or your wrapper invocation). See a screenshot below for a reference.
Features
Let's go through features of our extension, that can help you developing and running Patrol tests.
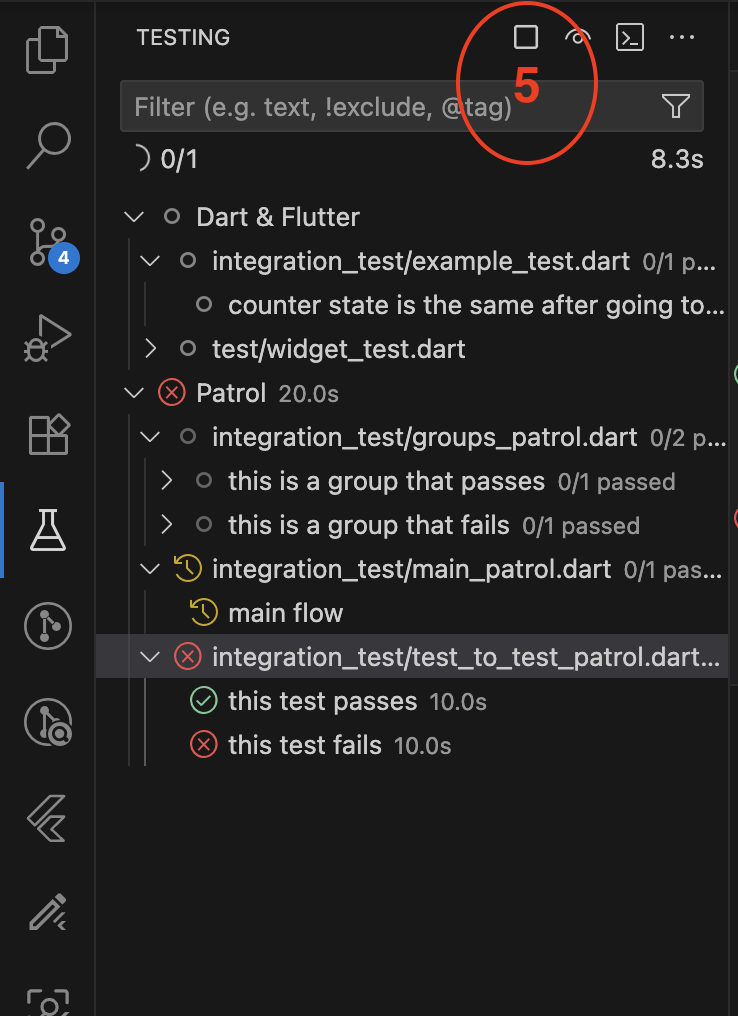
Test Explorer
Test Explorer is a tab on the left sidebar of VS Code. You can find there a list of tests discovered in the opened project. You should see there all kinds of tests in the project - unit, widget and integration - which comes from the Dart extension. Our extension adds a section with Patrol tests.
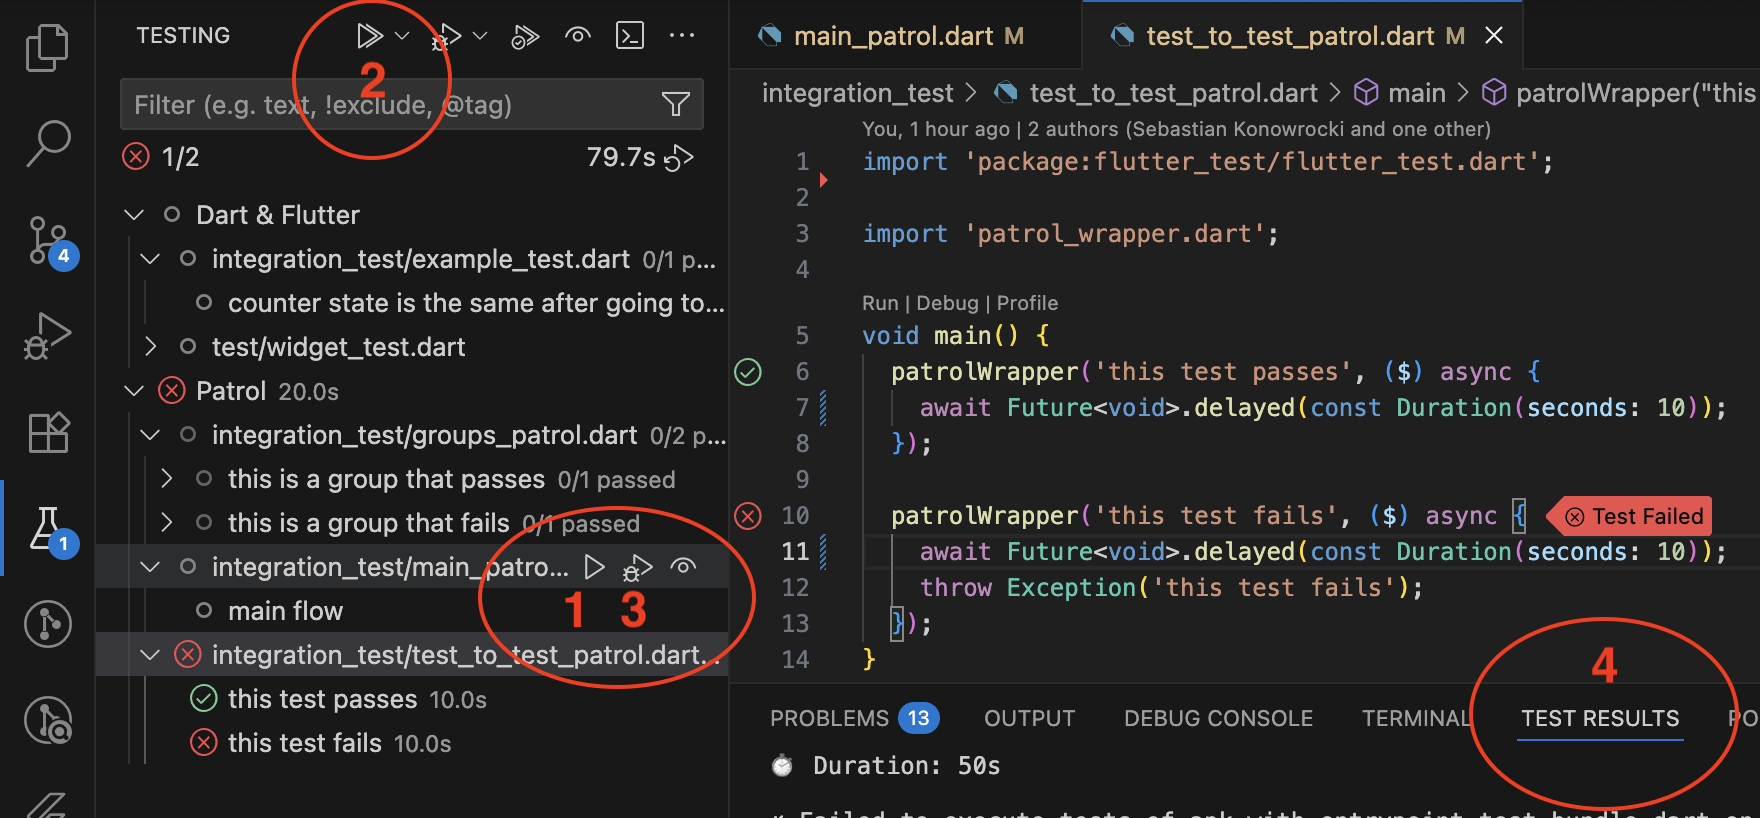
You can use it to:
- run a single test file with the play button (1) next to test file name
- run all tests with play button at the top (2)
- debug a single test file (3)
You can see logs and result of the latest test run started through VS Code in Test results tab (4). You'll also see there live logs from the current tests execution.
Running and debugging use the device chosen in VS Code.
The test execution can be stopped using stop button at the top. (5)
Keep in mind that running and debugging tests use commands from patrol_cli under
the hood, and you still have to have patrol_cli installed on your machine - activated
globally through pub or added to the project as a dependency in pubspec.yaml.
Running tests from file
Now you can run the tests by clicking the green play button beside first line of the test, as shown on the screenshot below.
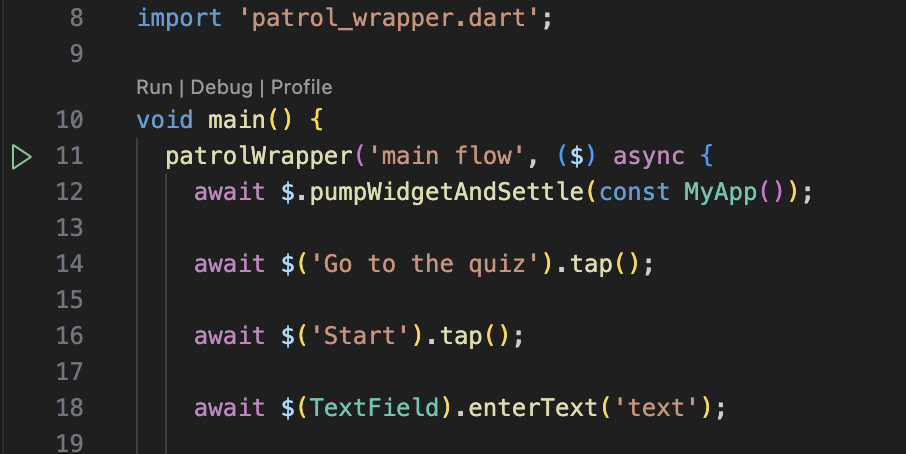
Be aware that if you have more than one test in the file, this button will run the whole test file.
Debugging tests
We combined Patrol's develop command with debugging feature of VS Code - now
you can debug your tests easier in our extension!
To start debugging, click on debug icon in the Test explorer tab (as shown on
screenshot above, by no. 3). It will start the test in develop mode. This
means that:
- only one test file can be debugged at once - do not use the button to debug all tests (available at the very top, works only for widget and unit tests),
- debugging will continue after the test is finished. This allows you to hot restart the test.
After the test is built, it will start executing and debugger inside VS Code will attach to it. It takes a while, you'll see a debugging toolbar when it's ready.
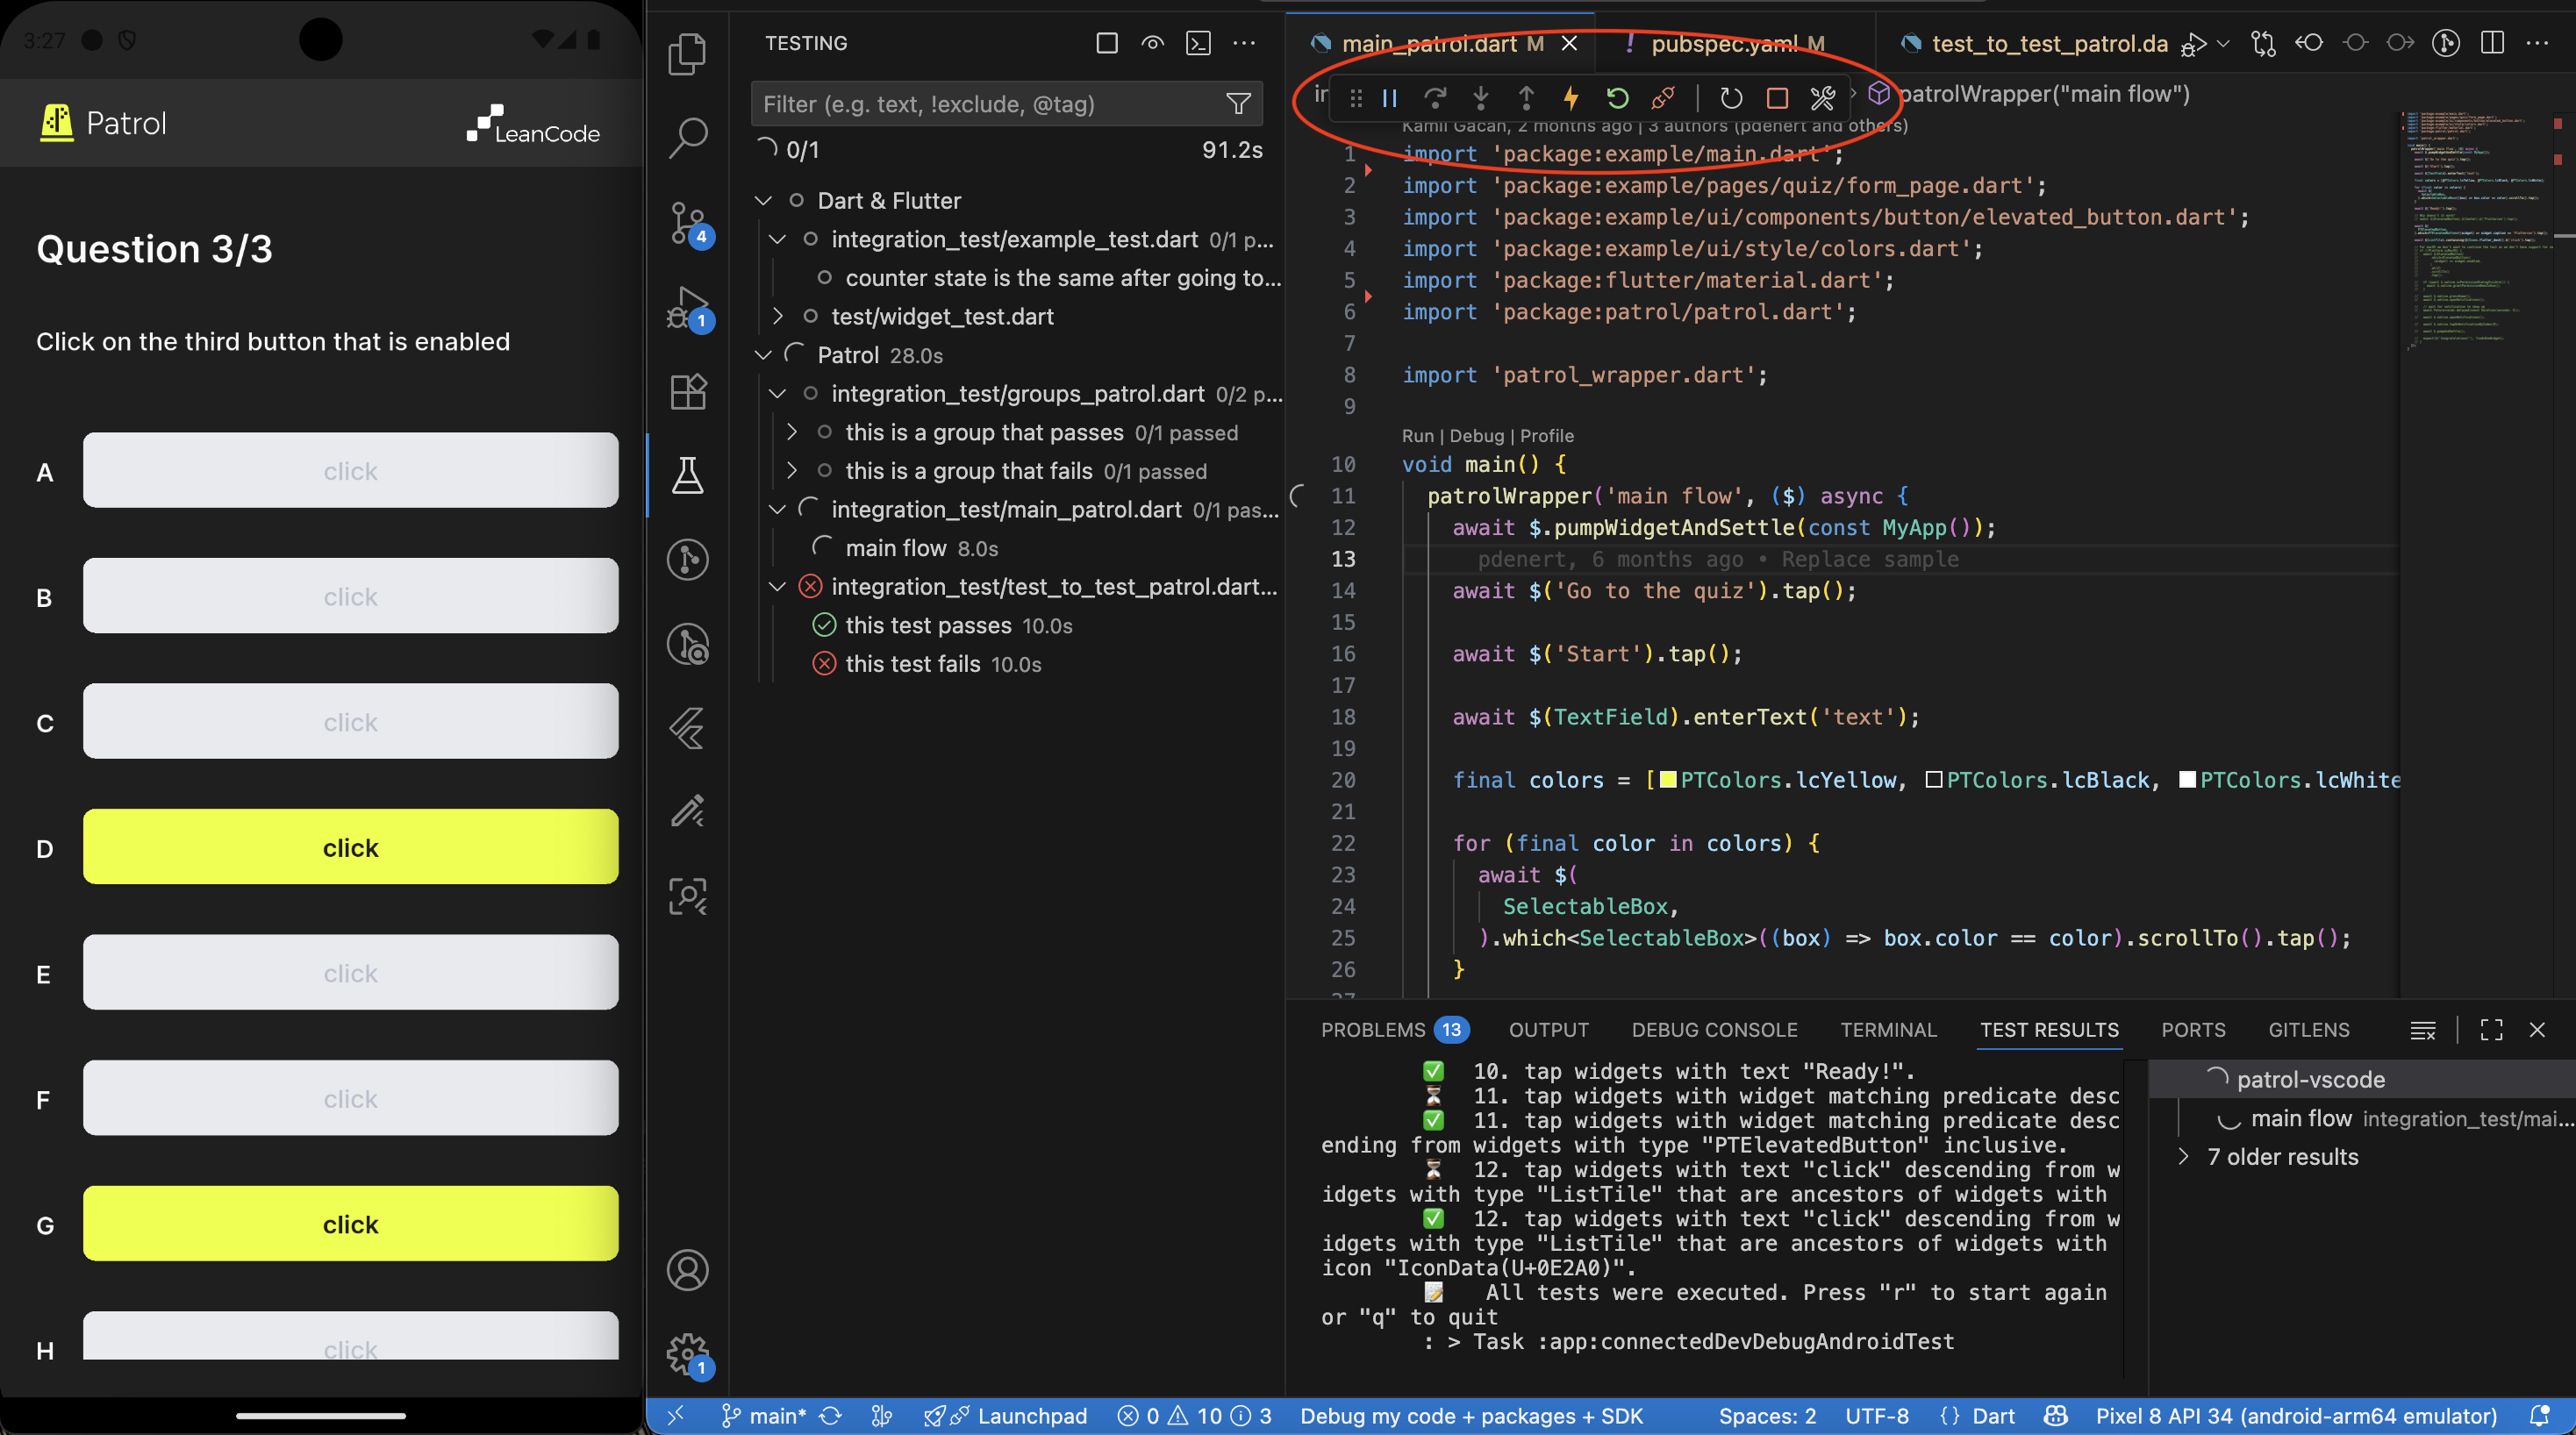
The buttons on the toolbar are from the left:
- 4 buttons to navigate debugging (pause/continue, step over, step into, step out)
- 2 buttons that don't work - they do nothing in this mode and are added by Flutter extension
- disconnect button, which disconnects the debugger but leave the test running
- hot restart button - use it to hot restart the test
- stop button - stops the test and closes the app on the device
- Widget inspector button - opens Widget inspector inside VS Code. More about devtools in general in the next section.
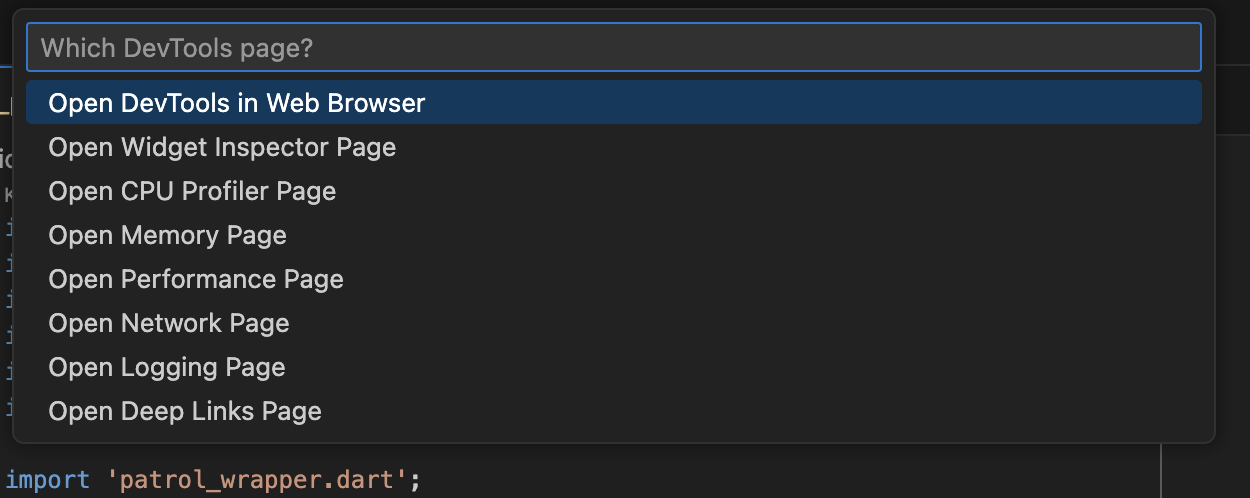
Devtools
You can open devtools in many ways:
- from a popup that appears at the start of debugging session (1)
- from command palette (2)
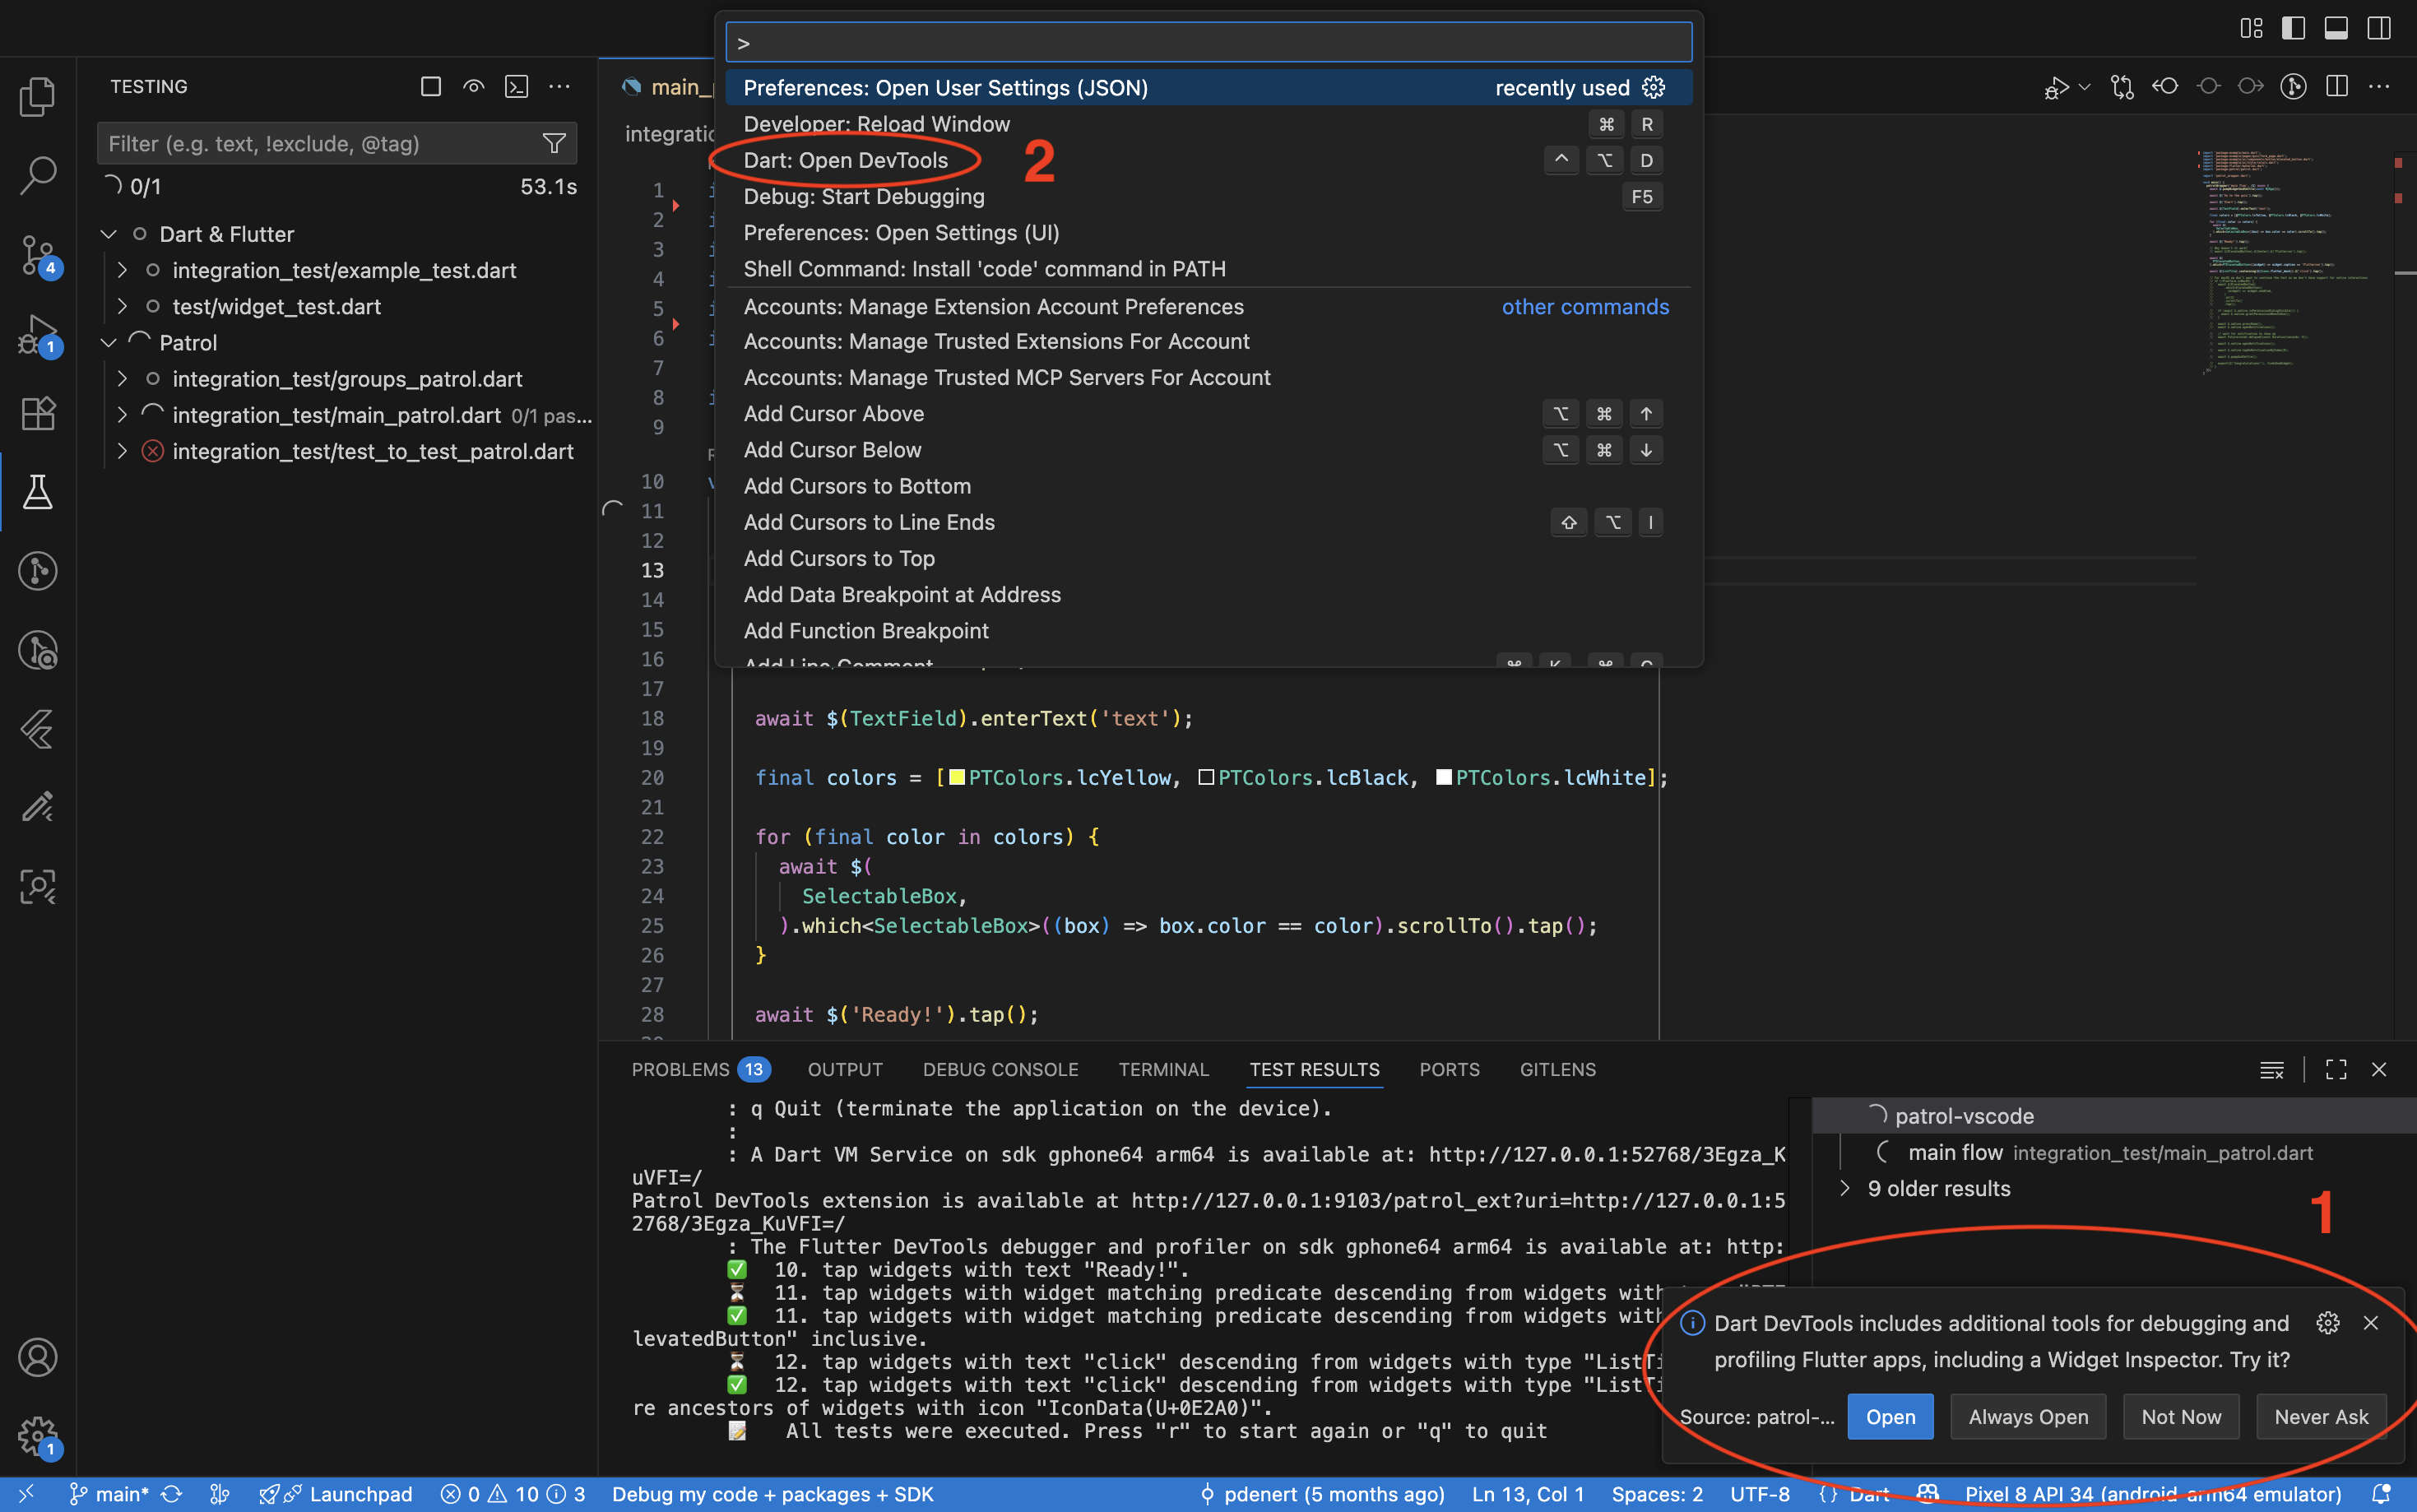
Both those ways lead to this dropdown, where you can choose the tab of devtools that you want to open or choose to open them in web browser.